Using the P3/COBOL Debugger
P3/COBOL includes a powerful Eclipse-based debugging system that may be used to debug monolithic COBOL programs, mixed COBOL programs and supporting native Java classes, and Java classes invoking COBOL programs.
Simple COBOL Debugging
Prerequisites
To begin debugging an application using the P3/COBOL IDE you should first be familiar with the workflow and capabilities of the Eclipse environment. The best way to do this for a first-time Eclipse user is to go through the tutorials supplied with Eclipse for a language that is familiar to the programmer, preferably Java, before debugging a P3/COBOL project. If Eclipse is a familiar IDE to the user, the workflow of P3/COBOL and the debugger should be familiar and natural, as applied to the COBOL language rather than Java.
Getting Started
A helpful cheat sheet is available to walk through the process of starting a COBOL program in the debugger.
Eclipse Cheat sheets
Go to Eclipse >> Help >> Cheat sheets...
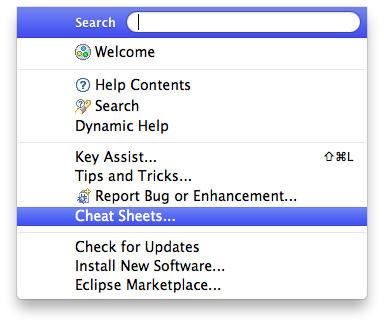
P3/COBOL Getting Started
Expand P3/COBOL and click Debugging Hello World followed by OK
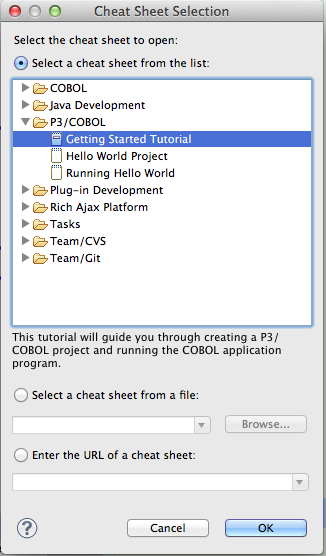
Go ahead
Follow the instructions on the cheat sheet to guide you through the process of debugging a Hello World program.
Now that you know how to start the debugger, you may set breakpoints, data watchpoints, and view/change variable values while debugging.
It is important to remember, no matter how you want to debug the program or which debugger you wish to use, you must either start the initial program using you chosen debugger or you must use the remote attachment capability of the debugger(s) you wish to use in conjunction with starting the program (no matter what language) with configuration parameters that "publish" the programs debugger connection parameters to the desired debugger(s). Both Java and COBOL programs may be started in a mode that allows the subsequent connection of either a Java or COBOL debugger, or both if mixed debugging is desired.
Configuring JVM Access Options in Eclipse
P3/COBOL 25.0 requires JVM access options appropriate for the Java version selected by a launch configuration. The P3/COBOL IDE can determine that version at launch time and add any required options that are not already present.
For a P3/COBOL Application launch configuration, the Arguments tab contains the following option, enabled by default:
Add required P3/COBOL JVM access options for the selected JRE
Clear the checkbox only when the required options are supplied by another launch mechanism.
A standard Eclipse Java Application launch configuration can use the same support when the Java application invokes COBOL later through the P3/COBOL runtime API:
- Open the launch configuration's P3/COBOL tab.
- Select Add required P3/COBOL JVM access options for the selected JRE.
- If Eclipse asks which launcher to use, select Java Application with P3/COBOL support.
The checkbox is disabled by default for Java Application configurations, providing explicit opt-in and opt-out control.
When enabled, the P3/COBOL-aware launcher applies to both Run and Debug launches. It preserves existing VM arguments and
does not duplicate required options already supplied in either --option=value or --option value form.
For launches outside Eclipse, see JVM Options Required by P3/COBOL.
Setting Breakpoints
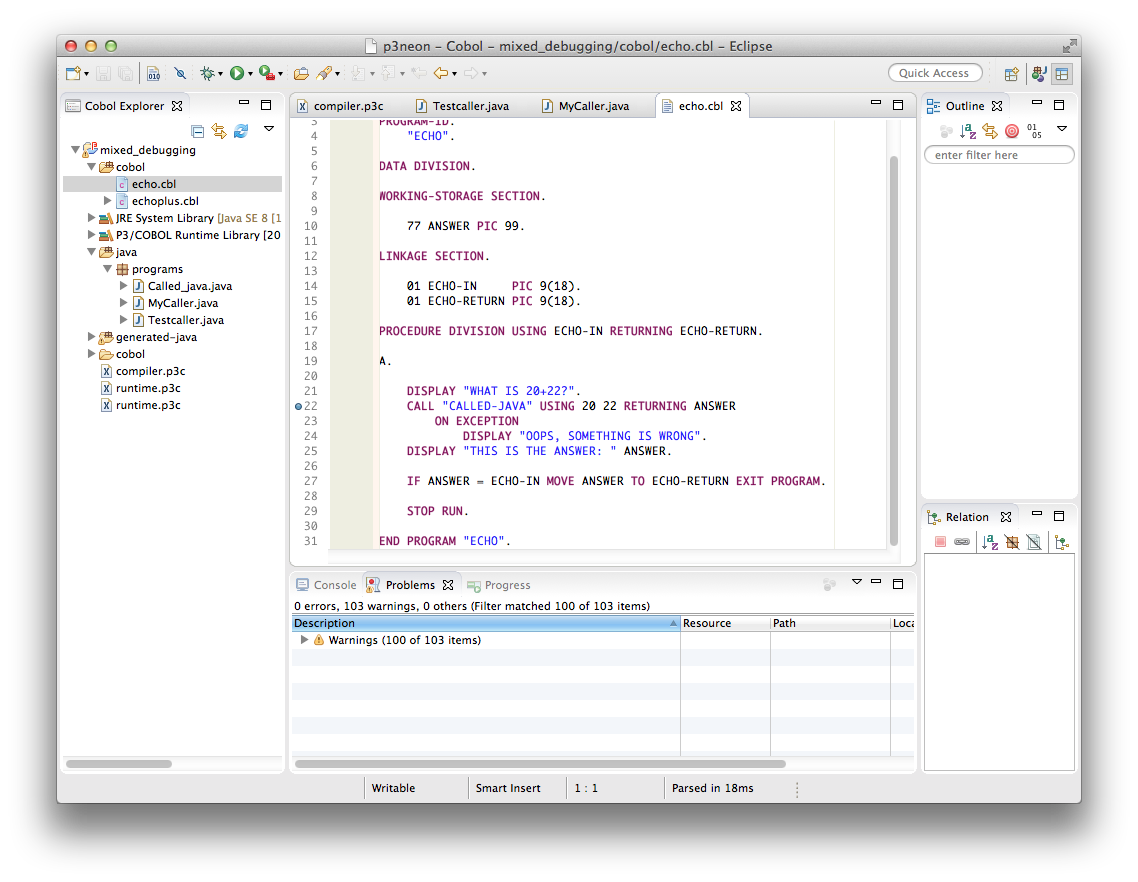
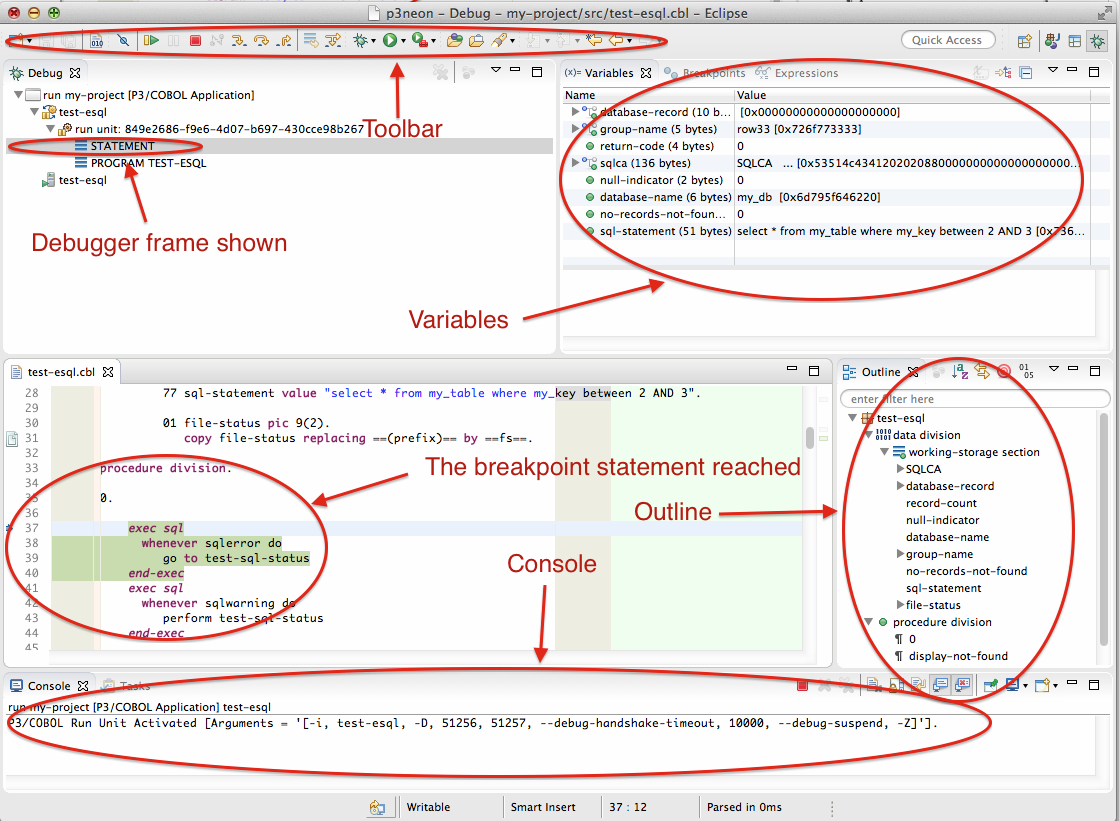
Setting breakpoints using the P3 IDE is almost identical to setting breakpoints in Java. You may do so either through the context menu of the COBOL statement line upon which you wish to break, through the Import menu of the Breakpoints tab in the Debug perspective, or, most easily, by simple double-clicking in the decoration column of the COBOL line. Below is shown a breakpoint set in a COBOL program.
You may also set an implicit breakpoint when starting the debugger by checking the Break on first statement box in the Debug Configuration.
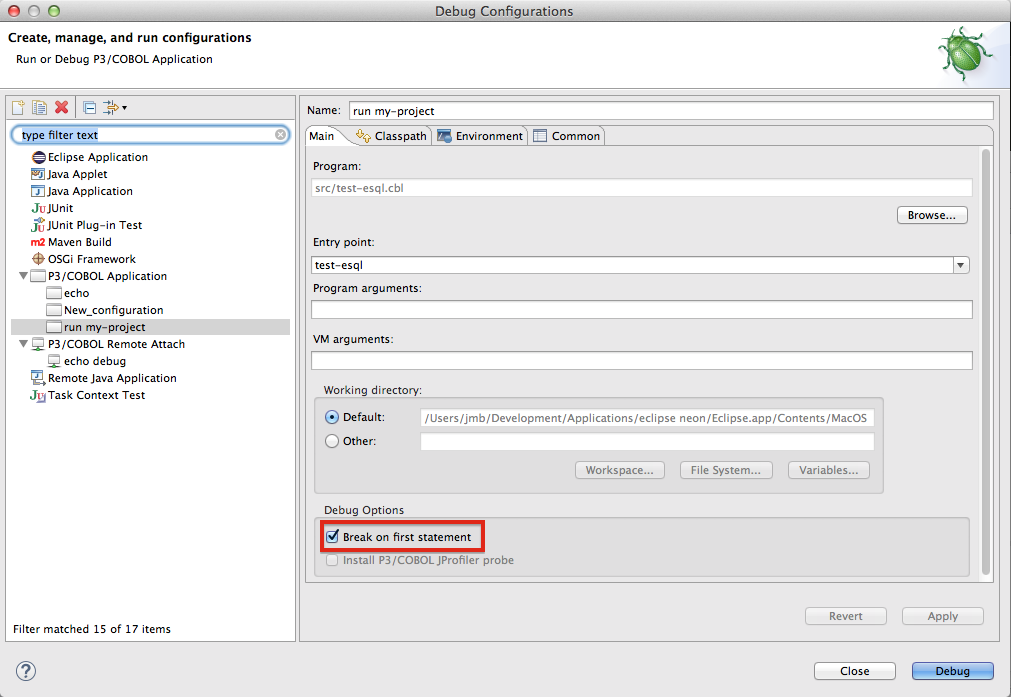 .. image:: eclipse-p3-break-on-first.png
The Debug perspective then becomes the focus of your debugging activities:
Viewing and Changing Variables
From the debugger, you can view and change the value of COBOL data items using the Variables window in the debug perspective. Variables are shown sorted by offset and, if the offset is the same, alphabetically. This means that group-level items will be shown alphabetically, and within a group items will be shown by offset (i.e., in the order defined in source). In the case of redefined items, the redefinitions will be in alphabetical order.
Due to the often vast collection of in-scope variables in COBOL programs, and in order to present the most likely variables of interest at a given point of execution, the debugger filters the variables shown such that only the ones referenced by the current (about to be executed) statement followed by those referenced by the most recently executed statement are shown. Should you wish to see the complete set of variables for the program being executed, you may select from the stack view the controlling program.
If you need to find an item within a large set of items, you should use the Edit menu Find capability. It will display a list of all the variables and allow you to search the list for the one you want. It will then receive the focus of the Variables pane.
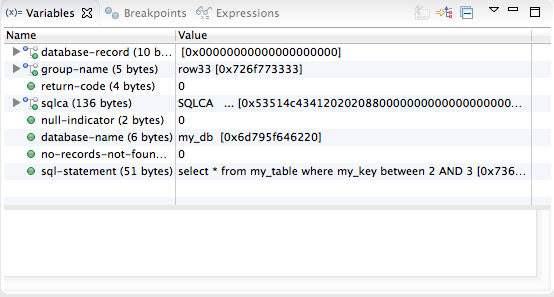
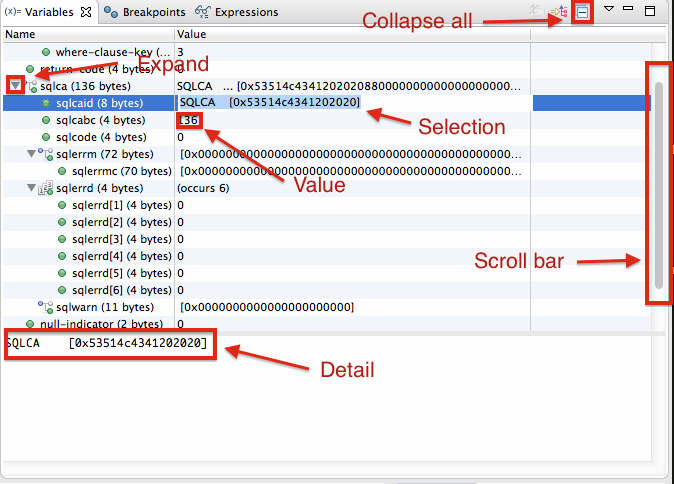
In this pane, you may scroll, expand, and collapse the view of program variables that are in scope for the current debugger frame. You may then select a variable for further detailed analysis including expansion of lower levels and inspection.
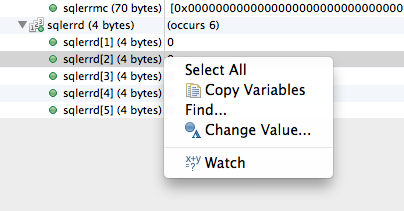
If you wish to change the value during debugging, you may do so by using the context menu on the item to be changed as shown here:
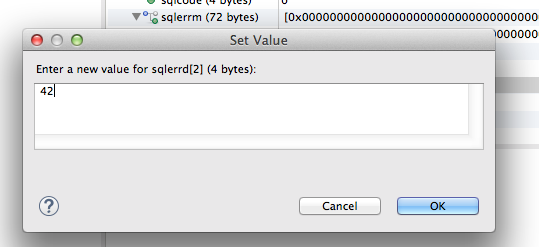
This will open a dialog allowing you to change the value of the item selected:
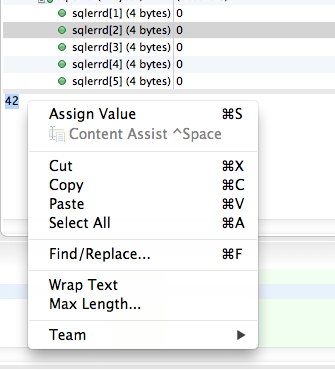
You may also simply type a new value in the Detail pane of the selected variable like this:
Setting a Watch
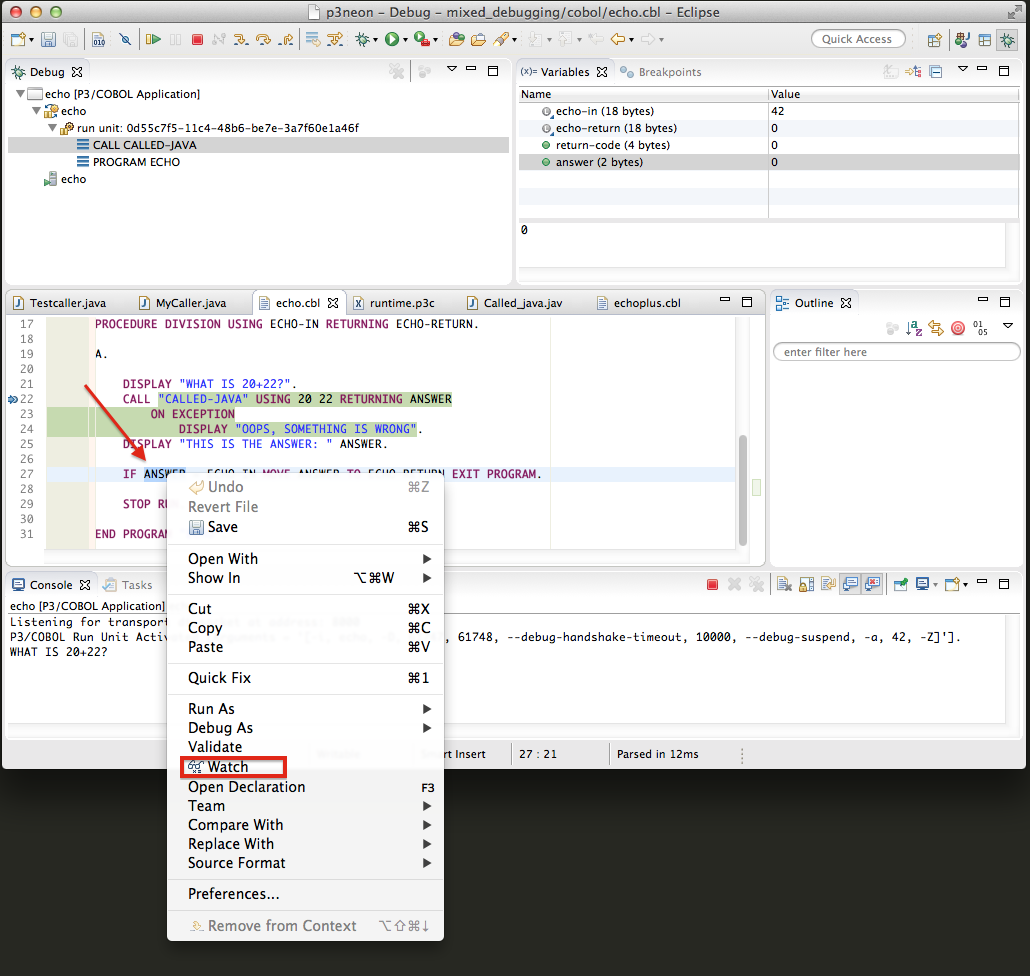
Sometimes you would like to know the value of a data item at the program executes. This would be done using the Watch capability. It can be accessed from the context menu of the debugger source window:
Or from the context menu of the Variable window:
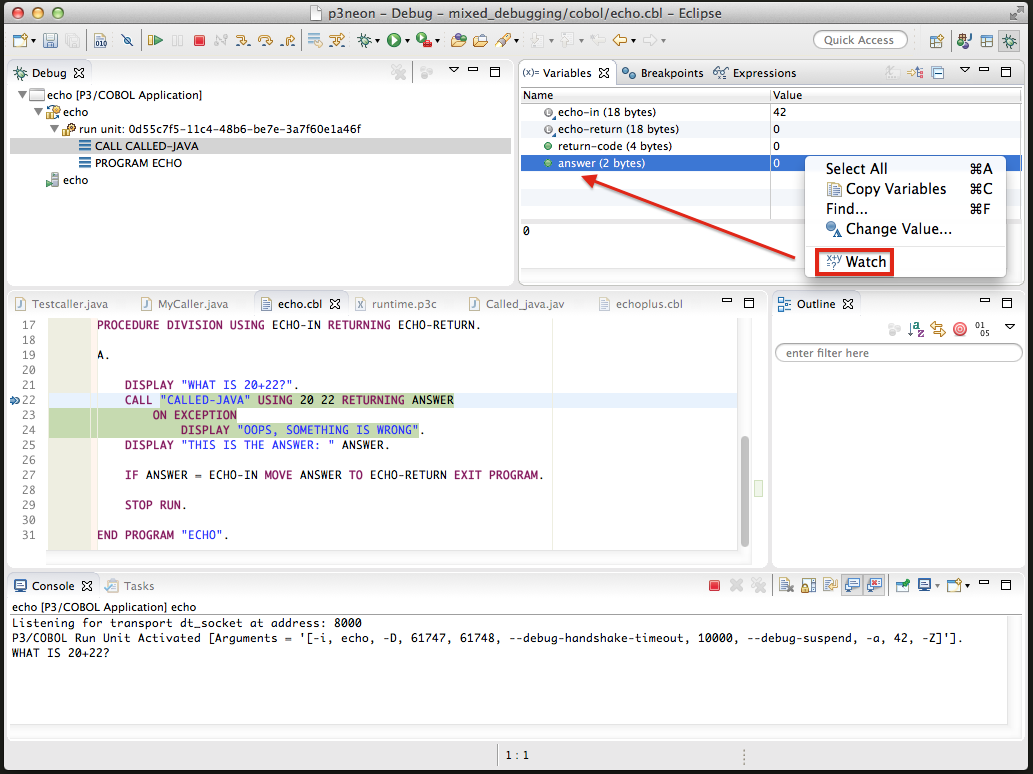
Either way, the variable chosen is added to the Expression window so that it's value is always available.
Stepping
Stepping a program under the control of the P3 IDE Debugger is also identical to stepping under the JDT Debugger.
Stepping Over
To step over a COBOL statement, i.e., step the statement in its entirety, including any nested actions of the statement, simply use the Step Over action using the Debug Perspective toolbar, or the context menu within the Debug window of the Debug Perspective.
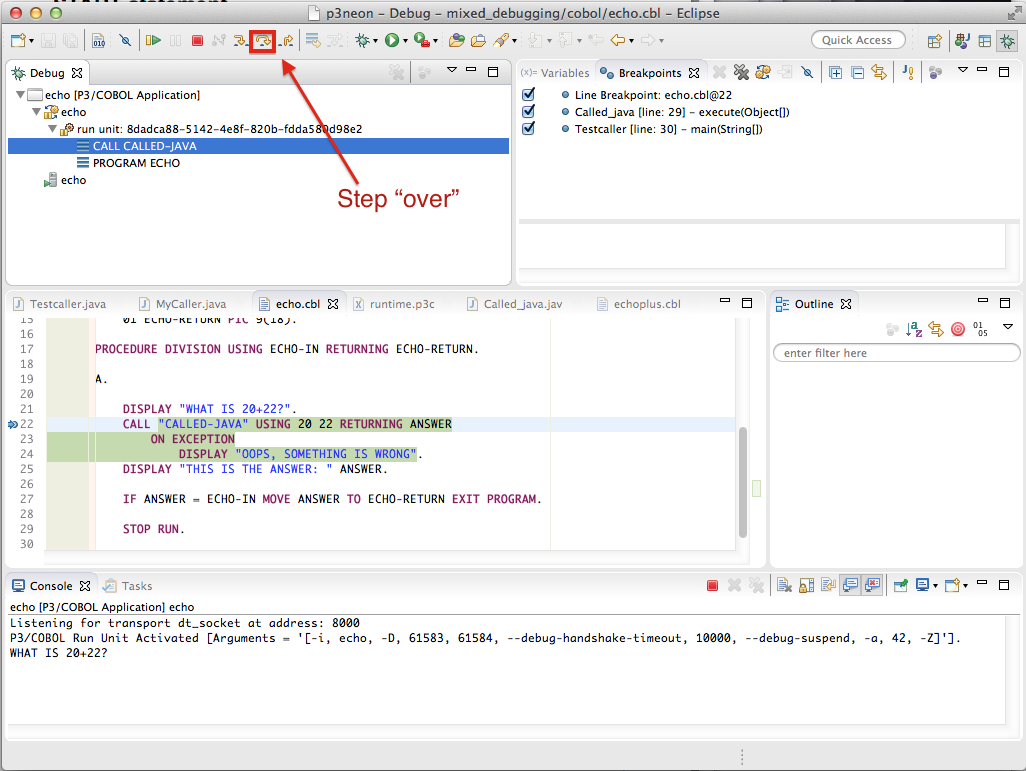
Or
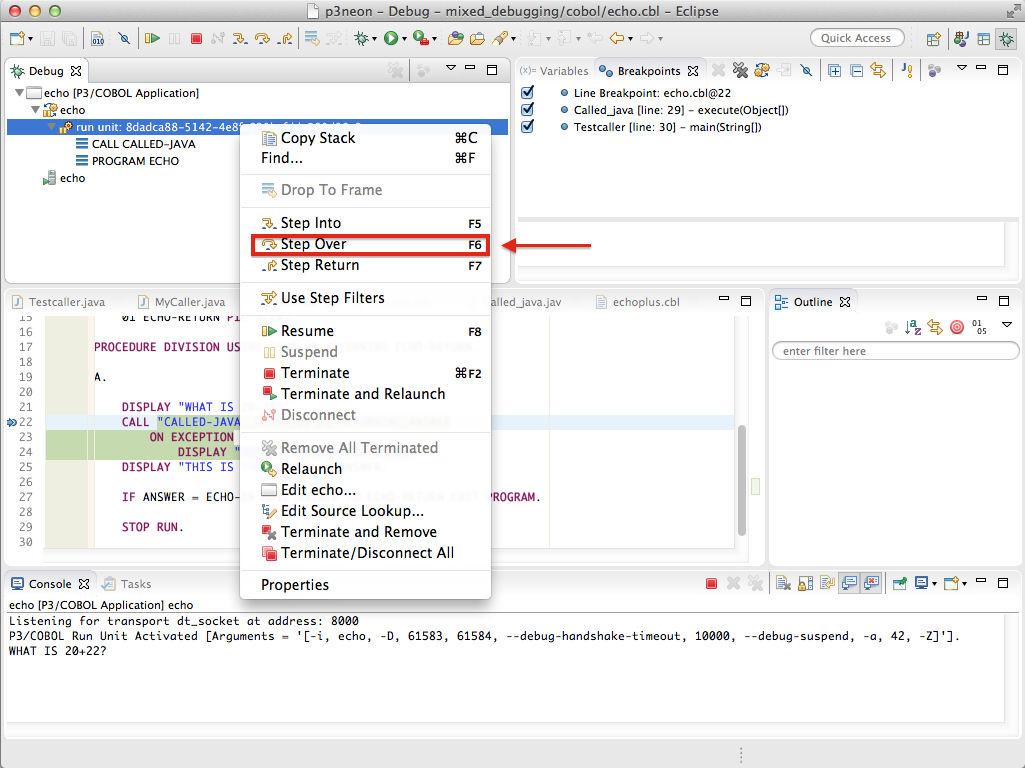
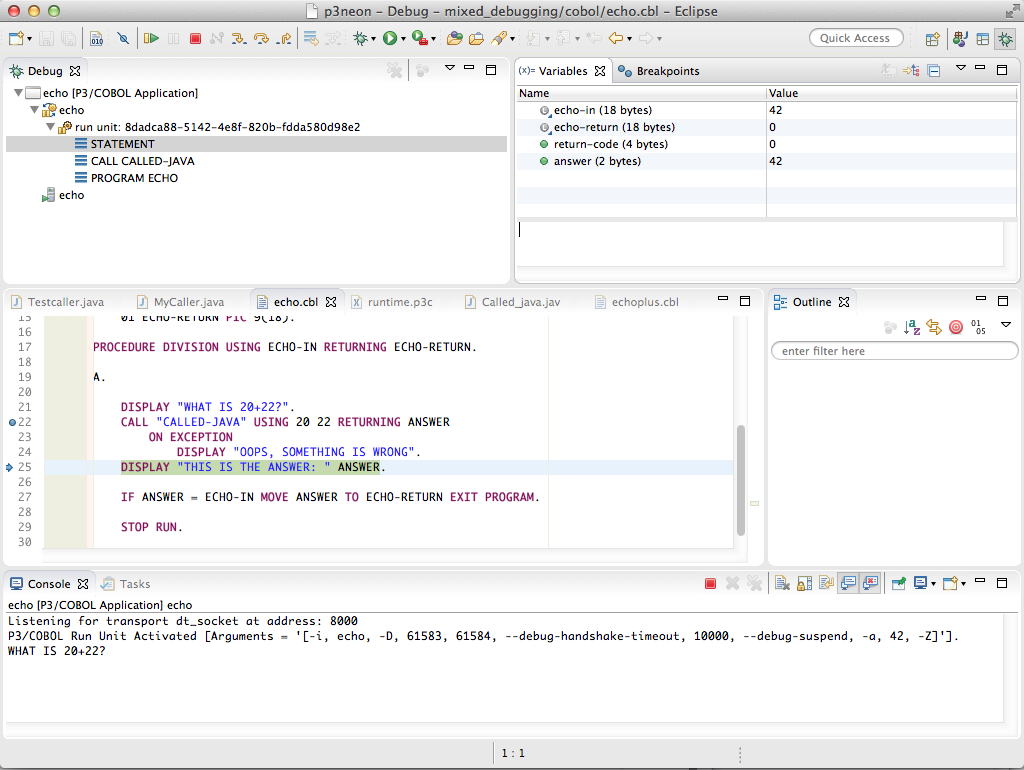
Both ways cause the program to step to the next statement at the same level as the one being stepped over, unless the statement itself is returning to a higher-level statement.
Stepping Into
If, on the other hand, you wish to step "into" a PERFORM or CALL statement, you would use the "Step Into" toolbar icon or the context menu:

Stepping Out-of
Once stepping within a COBOL program, you might want to step through the return statement of the program you are within. You would do this using the Step Return action as follows:

Setting a Watchpoint
If you want program execution to pause each time the value of a variable changes, you would set a Watchpoint. This can be done from the context menu of the Outline windows as follows:
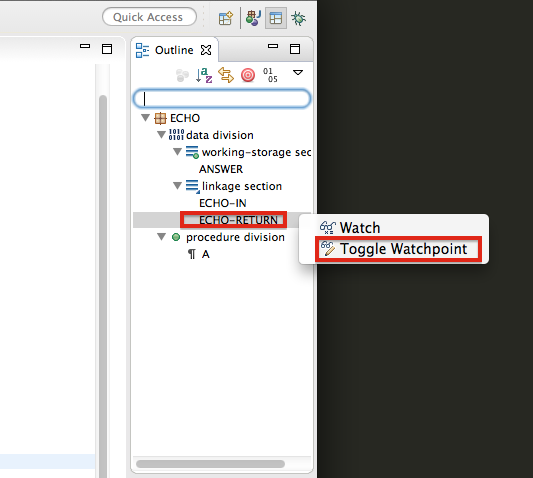
And you can see that the watchpoint is now set:
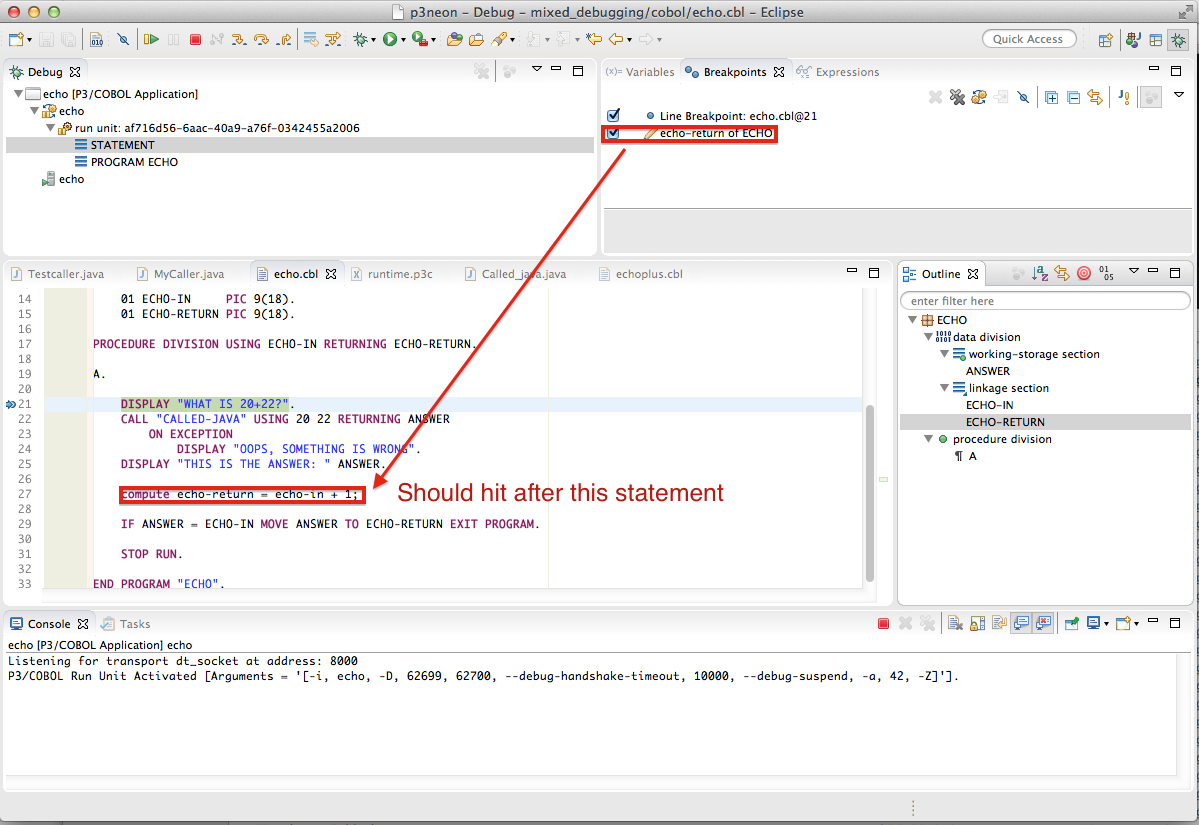
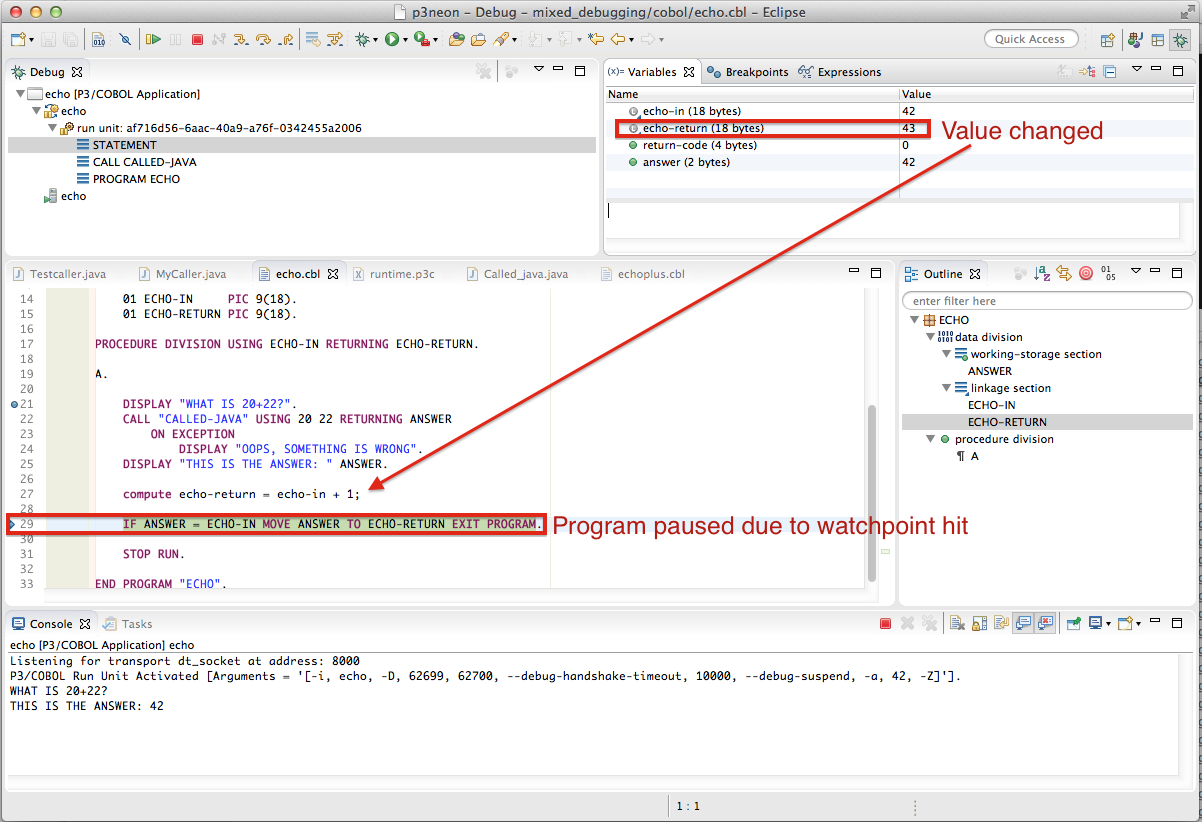
As execution continues, a breakpoint will occur each time a statement changes the value of the variable.
Remote Debugging
Both Java and P3/COBOL programs/classes may be debugged by the Eclipse debugger running in a different process, or even a different computer. This is known as remote debugging. In both cases, the remote debugger is "attached" to the running Java or COBOL program by using a network connection. The target to be debugged is described by the host name or IP address of the target computer, and a port (in the case of Java) or pair of ports (in the case of COBOL) that identify the target program. While COBOL and Java differ in the details of how the target program is configured to receive the debugger attachment, the overall flow is identical.
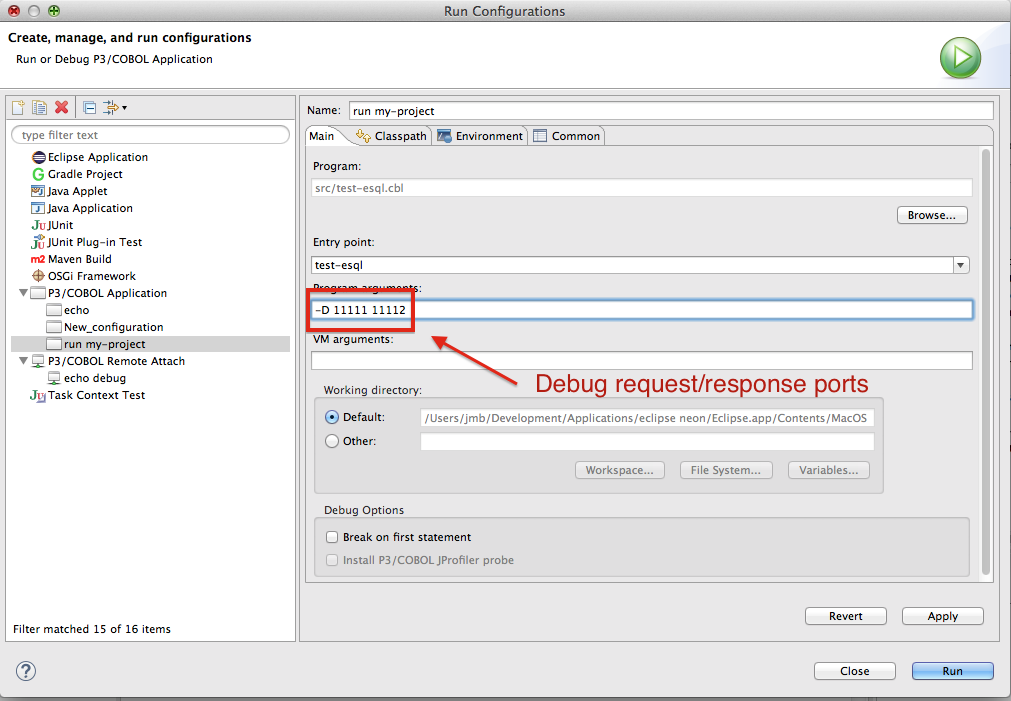
Remote COBOL debugging is enabled on the target program by configuring the debugger ports. By default, the COBOL runtime will attempt to receive an attachment from the debugger before beginning execution. By default, if the debug ports are configured, it will continue to allow a debugger connection at any time after execution has begun. This would be the normal way to start a program if it is desired that remote debugging be a possibility. Optionally, you may specify the ports and a timeout value, in which case the program will wait the indicated time for a remote connection to occur and then begin execution. This would be appropriate if you wished to set breakpoints or variable values to specific values before any execution (rare).
This illustrates starting a COBOL application to allow remote debugger attachment at any time:
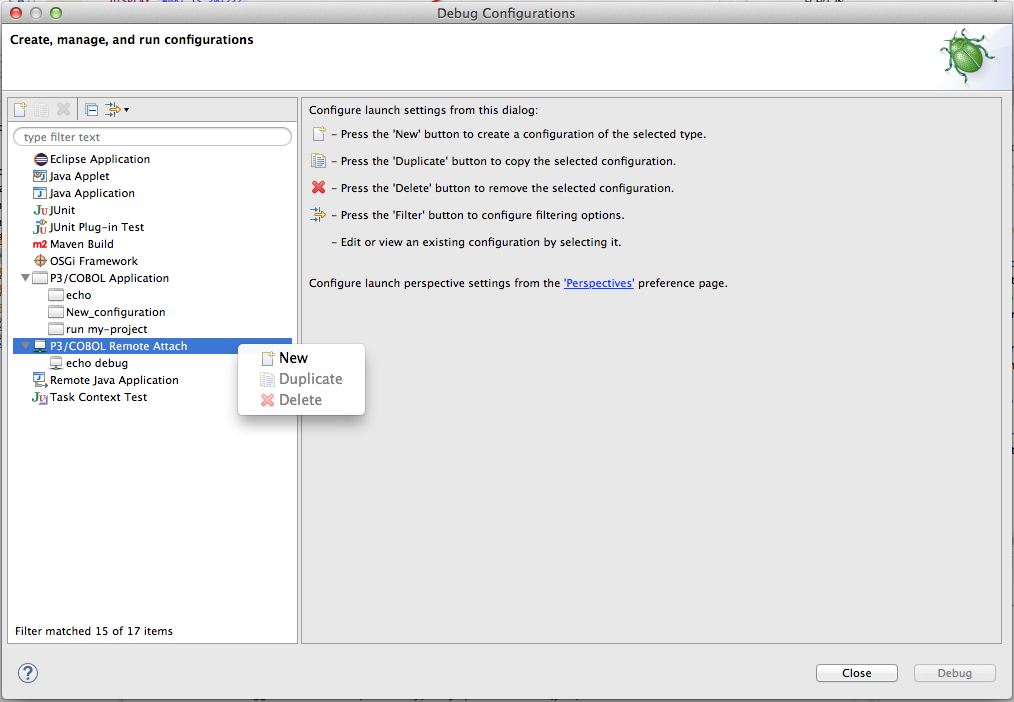
And then on the remote Eclipse environment, you would initiate the debugging using the P3/COBOL Remote Attach Debug Configuration choice as follows:
Then,
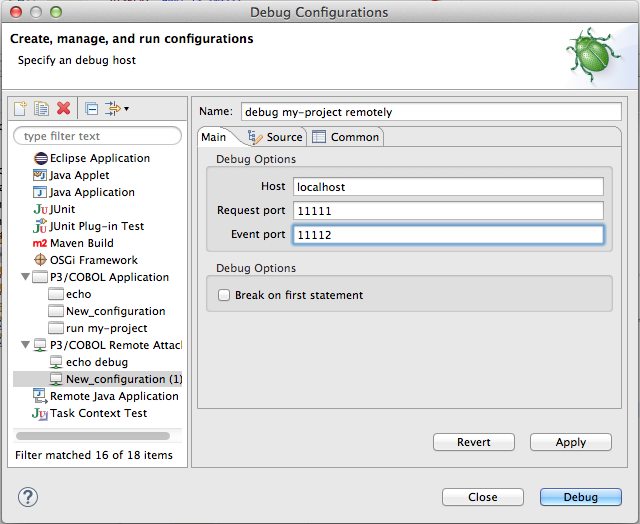
At that point, the debugger will attach to the running program as soon as the currently executing COBOL statement completes. Note that if the current statement is a long-running one (as in the case of an ACCEPT or a READ waiting for a lock, for example) the attachment could be delayed for some time.
Once successfully attached, the debugger is in control as in the case of a program launched by the debugger directly.
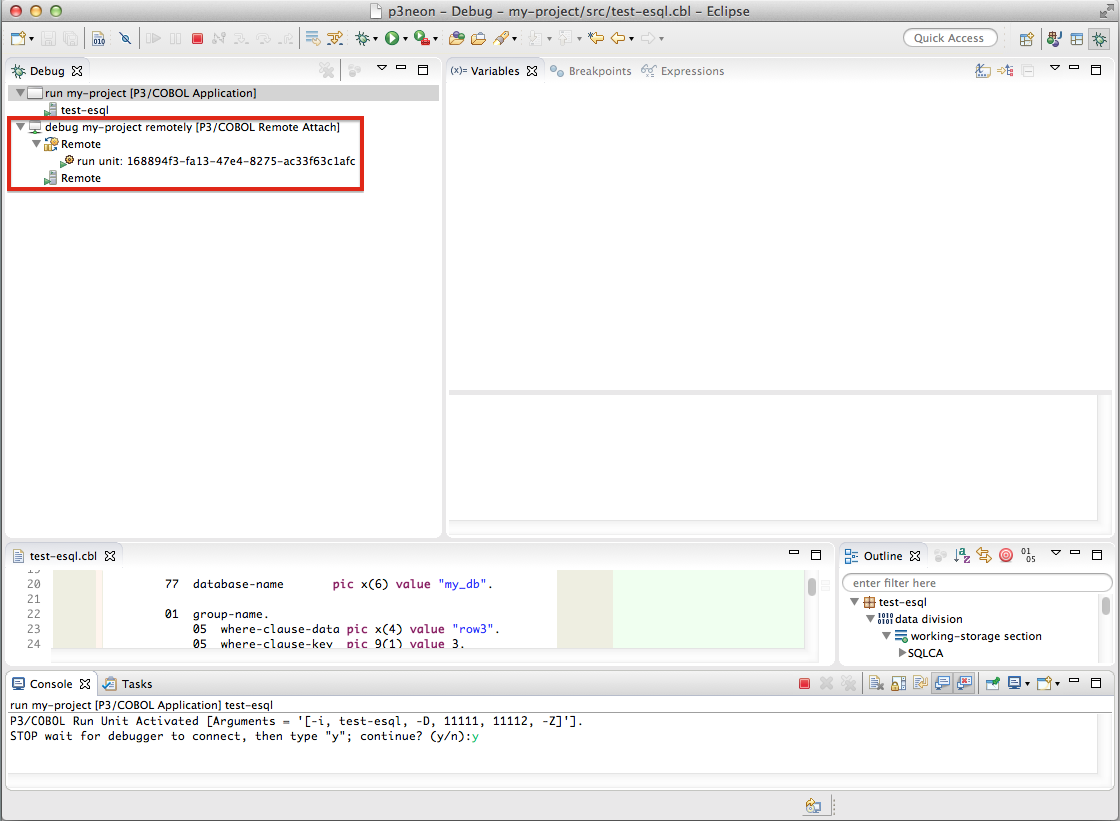
In this example, it is waiting on a breakpoint to be hit:
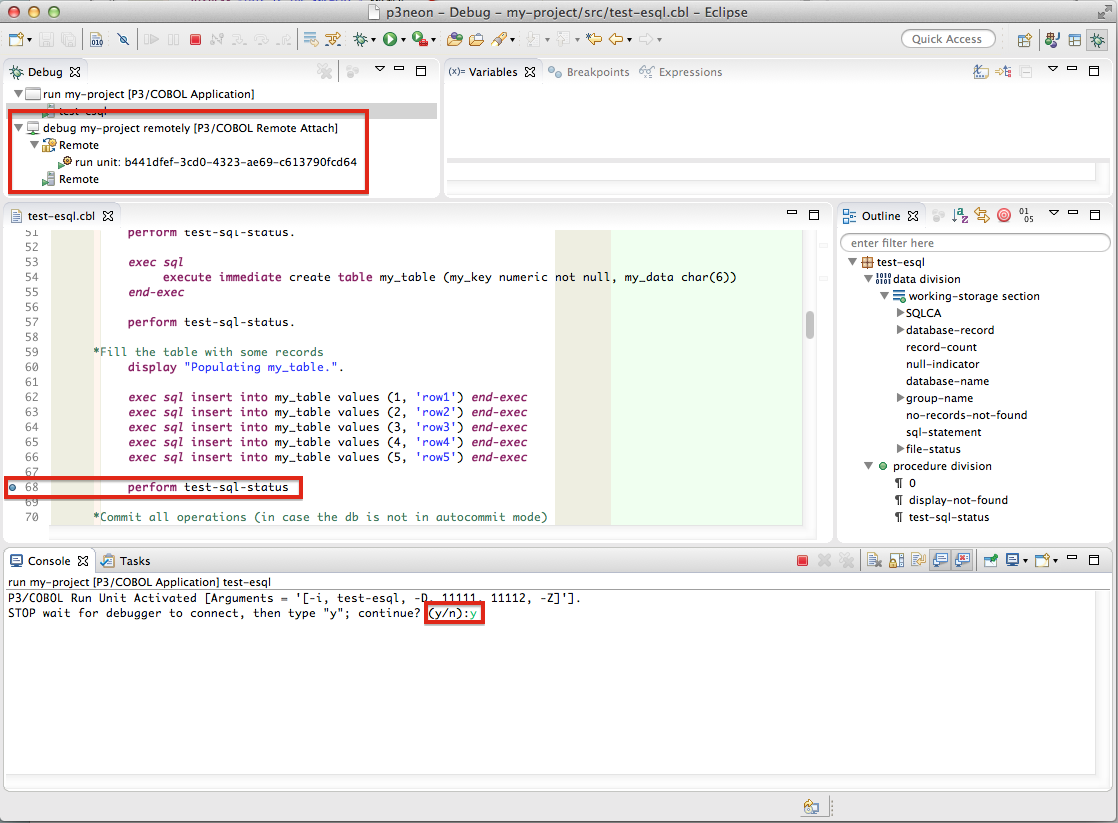
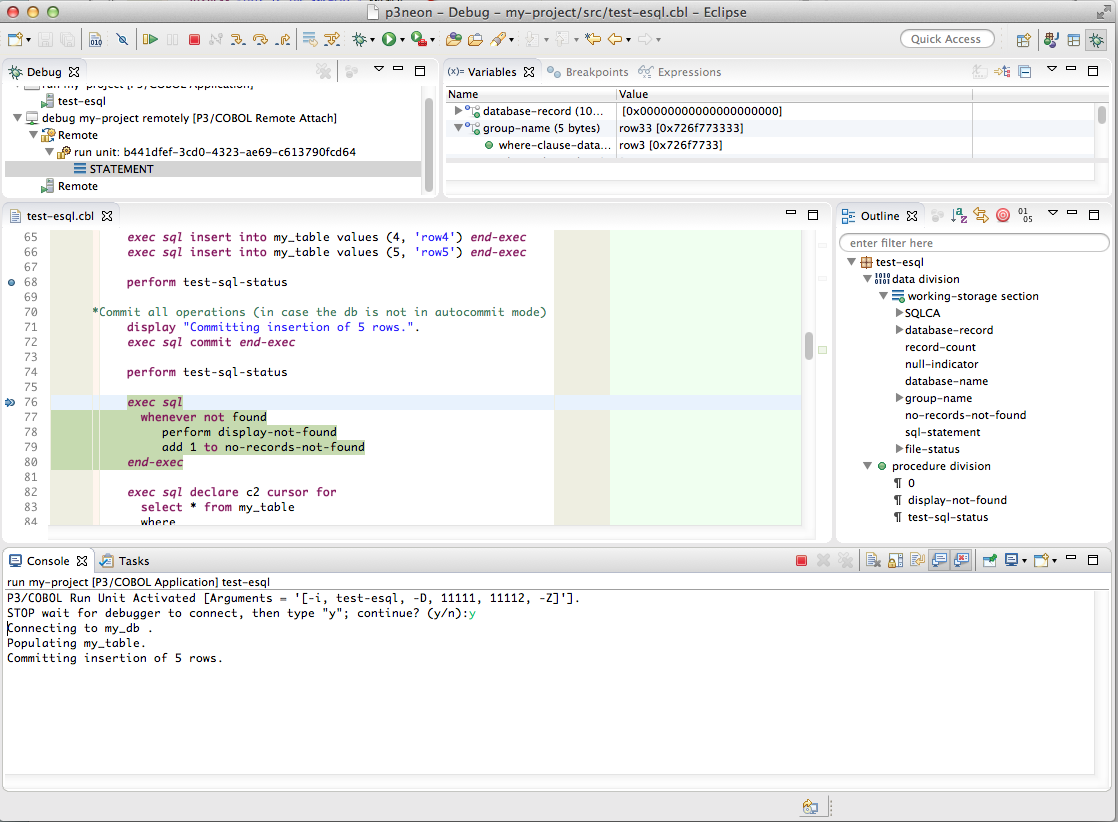
As breakpoints are encountered, debugging proceeds normally:
Debugging other Languages Calling/Used-by P3/COBOL
In order to debug non-COBOL programs calling P3/COBOL, called by P3/COBOL, or debug the Java code generated by P3/COBOL, it is necessary to use the corresponding non-COBOL debugging capability and, if needed, the P3/COBOL debugger concurrently. In the case of mixed COBOL/Java, this is accomplished with the standard Eclipse Java debugger, either directly if the Java is the initial program, or remotely if the COBOL is the launched program.
Debugging Java From P3/COBOL
The key to accomplishing this is to start the P3/COBOL program with the JVM configured to allow remote Java debugger attachment. There are several ways to do this (see Java documentation for details), but one way to do so is to use the following JVM arguments in the P3/COBOL Run Configuration:
-agentlib:jdwp=transport=dt_socket,server=y,address=8000,suspend=n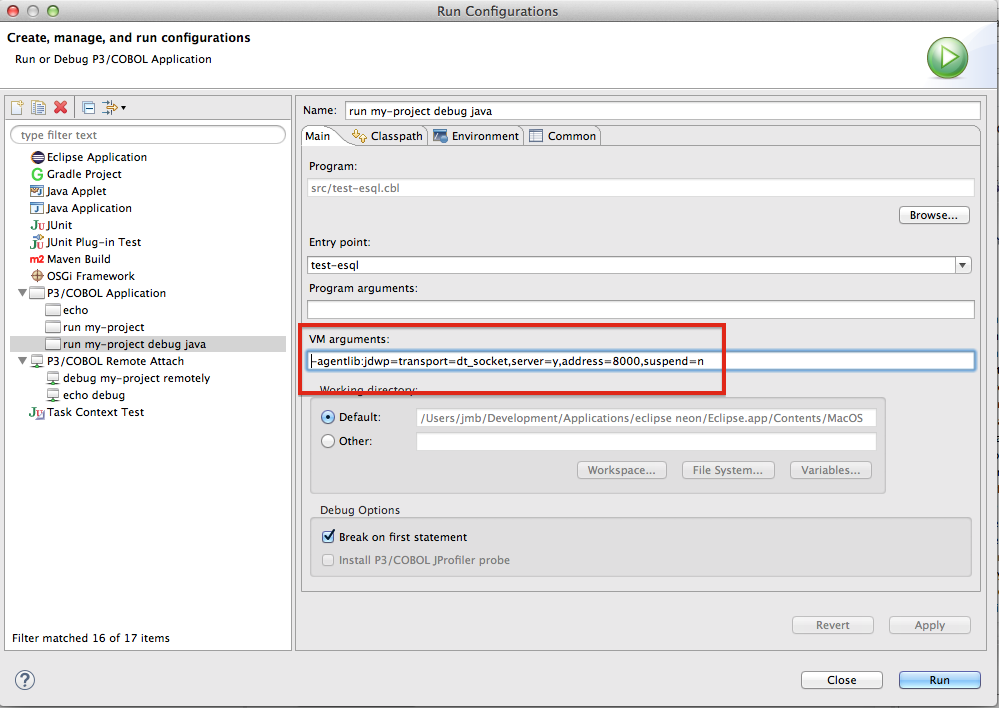
This will allow the Java remote debugger to be attached at any time during execution. If this is launched by the Eclipse debugger, it will permit both COBOL and remote Java debugging to be used.
Debugging Java That Invokes P3/COBOL
In this case, you would start the Java application under the Java debugger, or attach the Java debugger to a running
Java application. If COBOL debugging is not needed, the P3/COBOL debugger is not used and there is no special
configuration required for the COBOL program. If, however, it is desired to debug using both the Java debugger and the
COBOL debugger, the COBOL run unit(s) instantiated must be configured for remote debugger attachment. This may be most
easily done in the runtime configuration file using the <debug-port> option.
Once so configured, the run unit will monitor the debug ports specified for an attachment of a COBOL debugger. You may
then use the normal procedures described above to attach the COBOL debugger and Java debugger concurrently.
Note, however, that you must attach the COBOL debugger after the COBOL run unit is instantiated, or within the remote debugger attachment timeout period (10 seconds by default).